Website performance is a topic that's increasing in popularity as search engines, such as Google are weighing it more heavily when determining search rankings. Nowadays there are more and more tools that can help us measure our website's performance. What does performance mean when talking about a website? What are the measurements that we need to take in order to fully understand our website's performance? What tools are available to help us performing these measurements? I'm going to answer all of those questions and more. Let's dive in!
Taking your first measurement
We are going to look into Lighthouse as a tool to measure website performance. Follow along as I explain to you the fundamentals of using Lighthouse and what each of the metrics means.
Lighthouse
Lighthouse used to be an extension you could add to Google Chrome, which would load your website using parameters configured for different scenarios, such as on mobile, with slow connection speeds and while offline (yes, some websites can be accessed while offline, more on this later). It proved to be so useful that the Chrome team decided to add it to Google Chrome by default, so if you have Chrome installed, you too can open Lighthouse right now and I'll show you how.
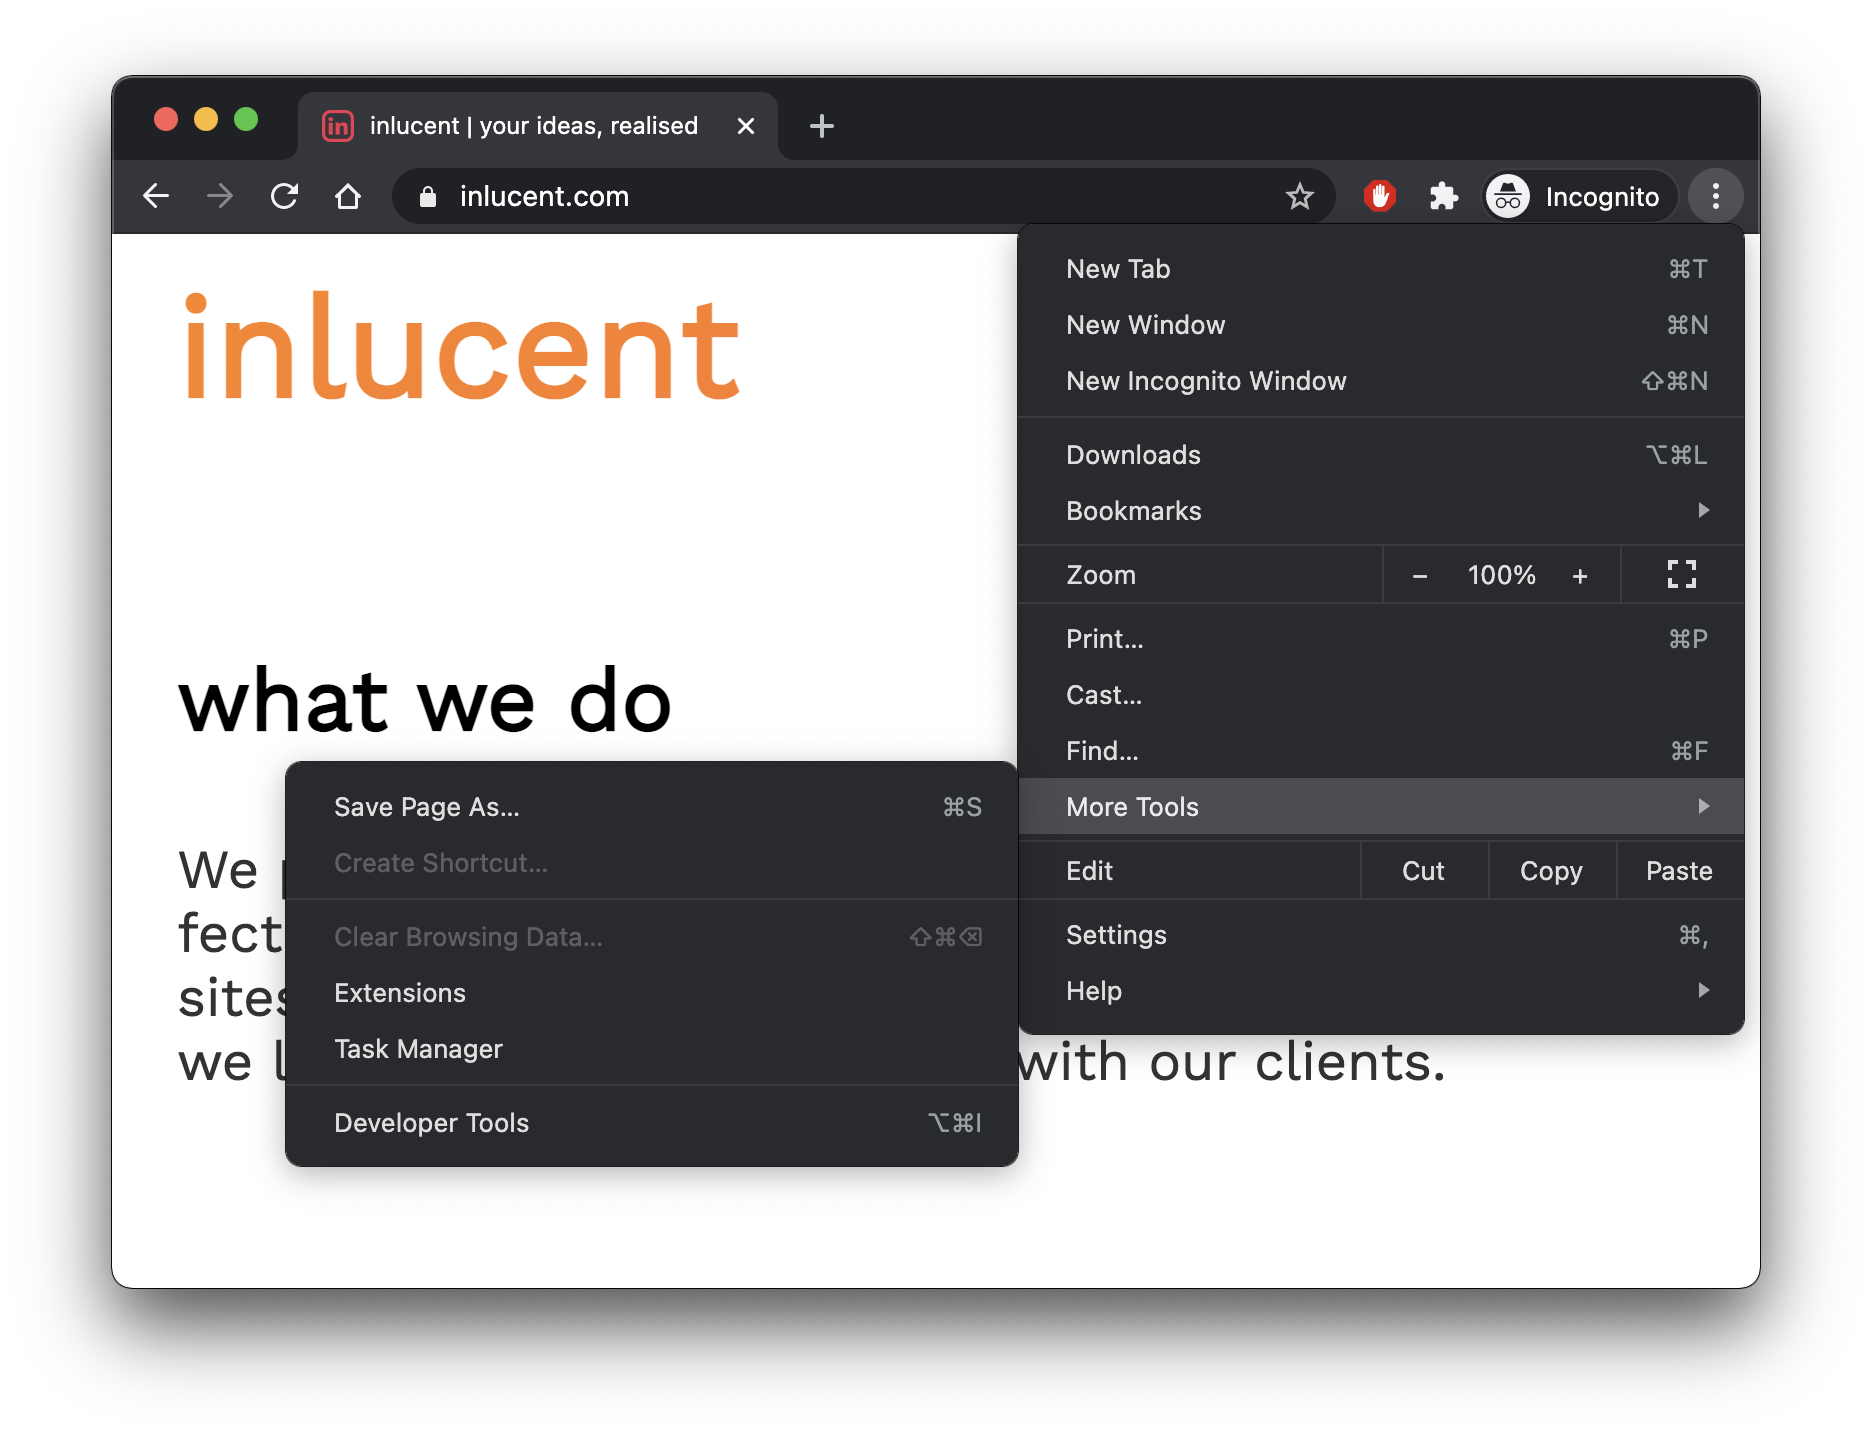
To access Lighthouse, you will need to open Developer Tools in Chrome. To do this you can click the ... icon in the top right corner of your Chrome window and find More Tools submenu, where you will click the Developer Tools option, which will open up the Developer Tools window.

Pro tip: you can also open Developer Tools by pressing
Ctrl+Shift+Ion Windows orCmd+Shift+Ion a Mac.
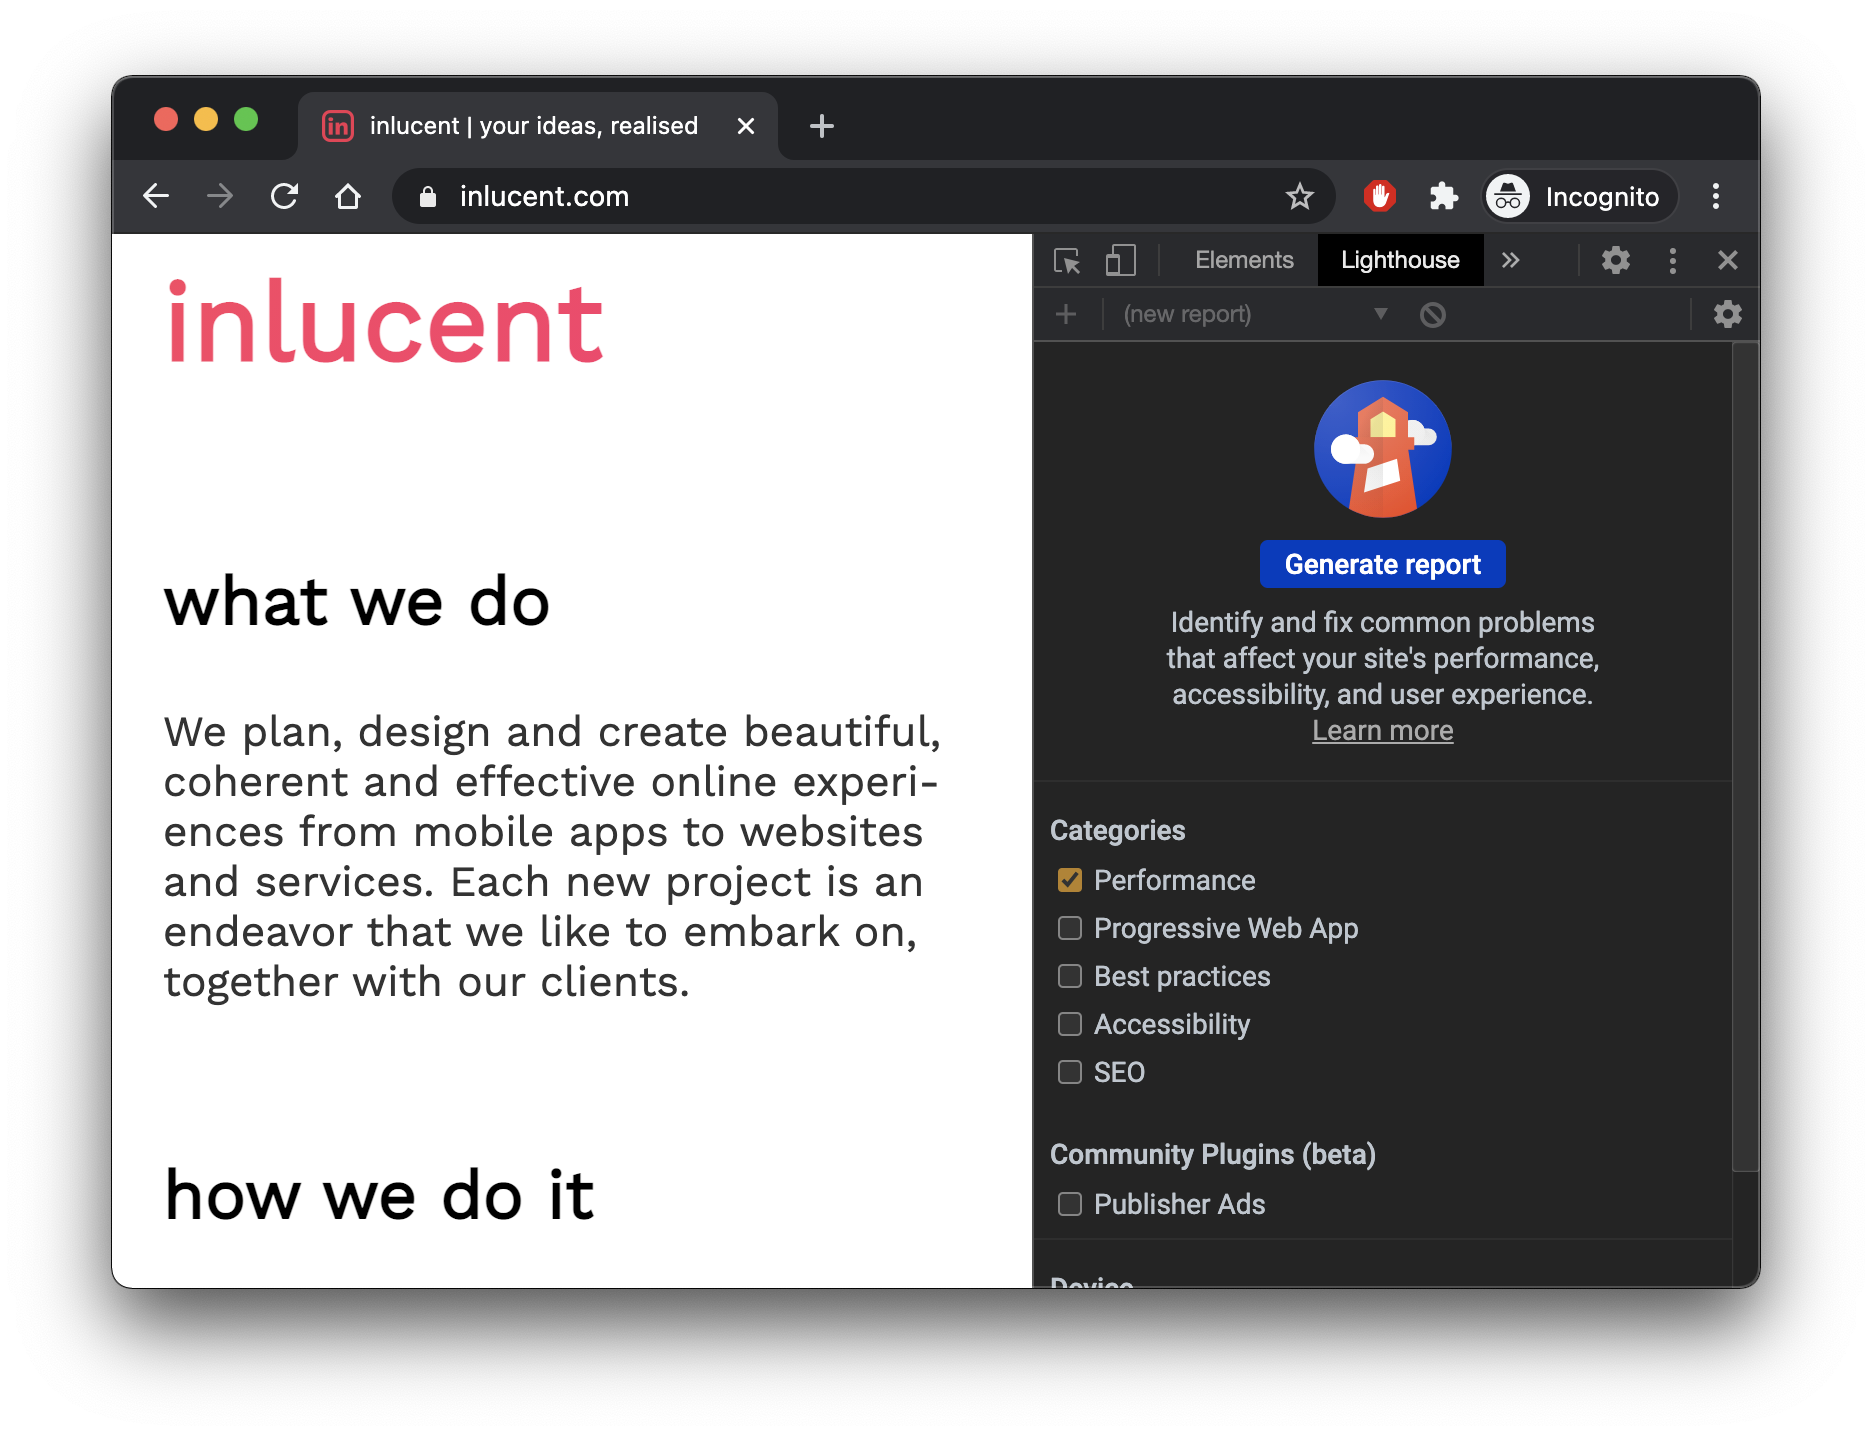
The next step is to find the Lighthouse tab within Developer Tools and then make sure there is a ticked checkbox next to Performance.

Finally, all you need to do is press the Generate report button, which will start running the performance audit. While it's running, you don't need to do anything, Lighthouse will automatically run the measurements and will show you the results as soon as it's finished. You will notice that if you had the Mobile option selected (default) your website will be displayed inside a little smartphone container. Google simulates a Motorola 4G to make mobile measurements which is a nice average device when it comes to smartphones. The Google bot also indexes your site using this same setup when it checks if it's mobile-ready.
Websites perform differently on different devices. For example a high-end smartphone with a lot of computing power will be able to display a website quicker in general than a lower-end smartphone. Desktop computers tend to also perform way better in these tests, which means your score may be lower when checking on a desktop device compared to a phone. That seems counter-intuitive, but it makes sense for Google to expect better performance from websites when viewed on a desktop computer.
When you measure your website's performance, you should be mindful of what device you want to focus on. Some websites may perform better on mobile devices and worse in desktop browsers and vice versa. If you need help deciding which device you should focus on, read my guide on Mobile-first Methodology.
The result

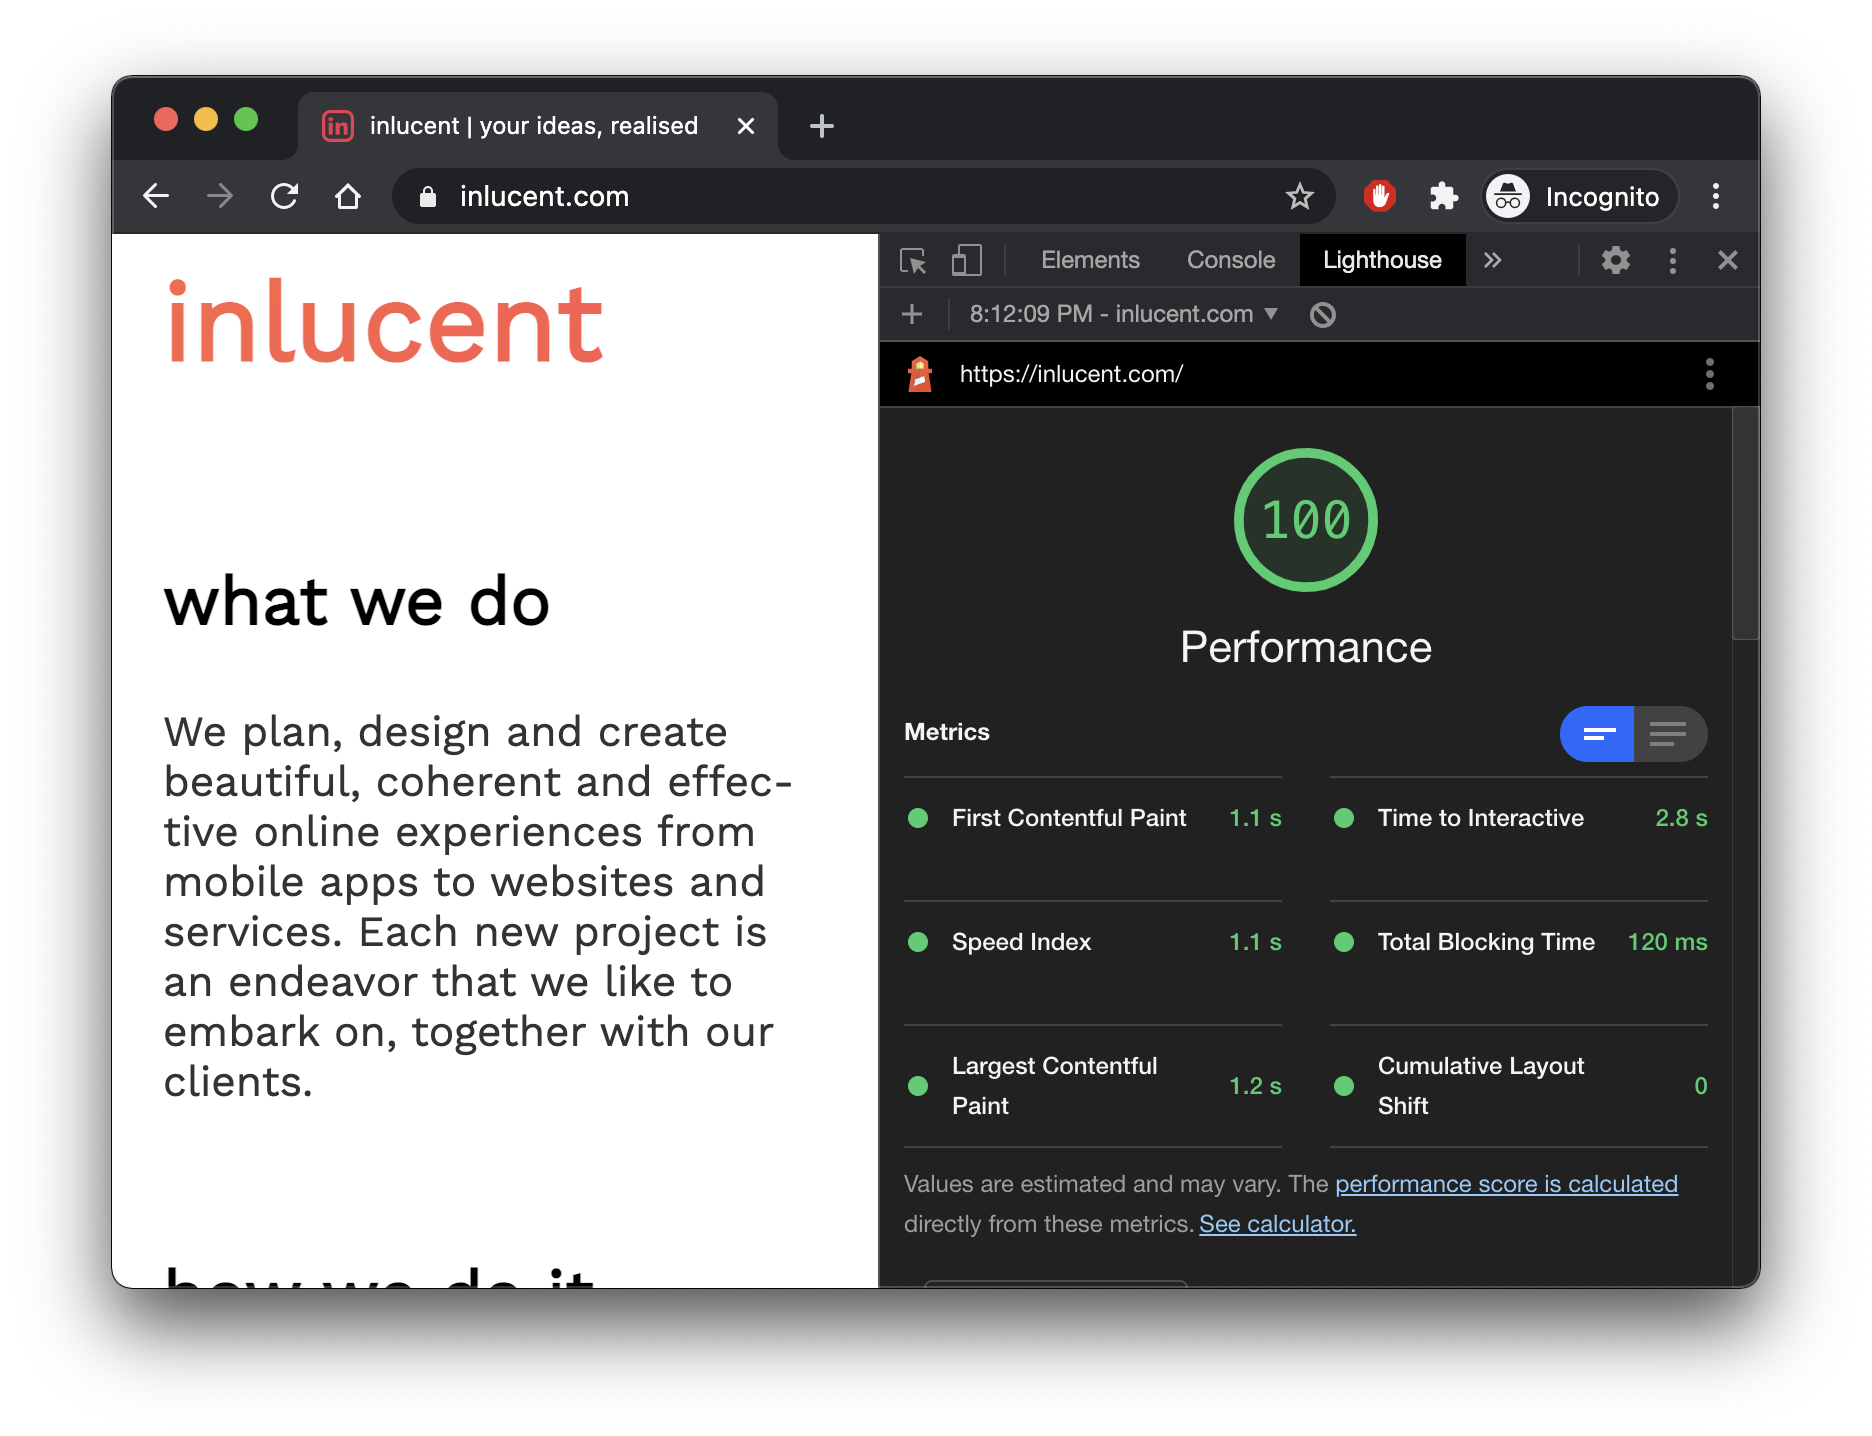
Google will list different metrics that determine what your overall score will be. What's also great is that you will see some suggestions with explanations of what could be done to improve those metrics. If you're confused by some of Google's suggestions, don't worry about it. Some suggestions may look daunting without extensive knowledge of web development, but that's what we're here for. Let us know if you need help optimising your site.
Why is my score so low?
Just because your score is low, doesn't necessarily mean that your website is bad, or even that it's slow. In fact there are factors that affect Lighthouse's measuring abilities. If you feel like the result you're getting is unreasonable, try the following steps:
- Close all other programs
- Close all other browser tabs
- Use Private Browsing to perform the measurement
The third one could bring the most improvements, because usually the key factor in slowing down websites is an excess of browser extensions. If you have a lot of browser extensions, in Private Browsing mode you will see a big improvement, but do keep in mind that your users may also have a lot of extensions. While there's nothing you can do to stop them from using those, you can always make sure that your website loads as fast as possible, to reduce the impact of those extensions.
Now to find out what can be done to improve your website's performance, let's unpack what metrics there are and what each of them means.
First Contentful Paint
Or FCP for short is how long it takes, from the moment the browser starts loading the page, to the time the first elements are drawn on the screen. There are multiple factors that directly affect this result. The first one is Time to First Byte or TTFB, which is how long it takes the browser from the initial request to receive the first piece of information from your website. The largest factor in this metric is network speed. The slower the internet connection of the user, the longer it takes for the data to arrive. On a good internet connection a high TTFB means that the server where the website is served from is slow or is a long way away from the user physically.
To improve TTFB you can invest in better, quicker servers, which are generally more expensive over time, or make sure that the servers you're hosting on are located where your key audience resides. For example if you expect most of your visitors to be from the UK, you may want to look into hosting that offers data centres in the UK, or in neighbouring countries, like France, Germany or Ireland.
The first paint is the most important. A study by Google determined that 53% of mobile users will leave a website if it takes more than 3 seconds to load. Does your website load fast enough not to lose half of its potential traffic?
There are generally two types of websites when it comes to first paint speed.
- Server-rendered — the first data a browser receives is the content it should paint.
- Client-rendered — the browser receives scripts that need to run before the browser knows what needs to be painted.
As a general rule of thumb, client-rendered websites will perform very badly on the First Contentful Paint metric, because they need to do some extra work before they can instruct the browser what to paint. Client-rendered websites — also called web-applications — are becoming more and more popular, which means there is a lot to be gained when optimising these websites. To improve FCP you should make sure that your server always sends as much data as possible on the first page load.
Largest Contentful Paint
Or LCP is the time from the initial load request, to the time the largest chunk of content appears in the browser at once. Going back to server and client-rendered websites — what you'll find is server-rendered websites will have a LCP time very close to their FCP time, while client-rendered websites will have a considerable gap between the first data displayed and the largest chunk of data that comes into view.
To improve LCP, the same principles apply as for FCP, with the addition that deferred content — content that isn't shown initially but deferred until a later time while the website had already loaded — should be kept to a sensible amount.
Speed Index
This is less technical and more of a real-life speed score of a website. It does better at indicating what users perceive when loading a website, compared to FCP and LCP.
To improve Speed Index, you should reduce the work the browser has to do when it's executing scripts, creating elements such as text, images and videos, and responding to user events such as clicks and scrolls (also called main thread work). A more technical solution to improving Speed Index is to reduce JavaScript execution time. JavaScript is a programming language that's used on the web to add improvements to websites, such as interactivity.
Font loading is another relevant topic here, because most websites load some custom fonts, usually from Google Fonts, that make the website look better but add to the time it takes to load the website. There are different strategies to loading and displaying fonts and the correct one will depend on your situation, but it's important not to use a strategy that keeps text unreadable for any period of time.
Total Blocking Time
Or TBT is the next metric that comes into play. It's measuring the time from FCP to the time the user can actually interact with the site, e.g.: click on buttons, navigate around, scroll down and type in input fields. This metric should be kept to a minimum, because users will find it confusing to see a website that seems to be there, but isn't responding to their interactions. Reducing main thread work, explained above, will have a significant effect on reducing TBT.
Time to Interactive
We're almost on our last metric here. TTI is the total time it took from the initial page request to when Total Blocking Time expires and the website becomes usable by our visitors. To improve on this metric, you should take the steps explained above for reducing Total Blocking Time and improving Speed Index.
Cumulative Layout Shift
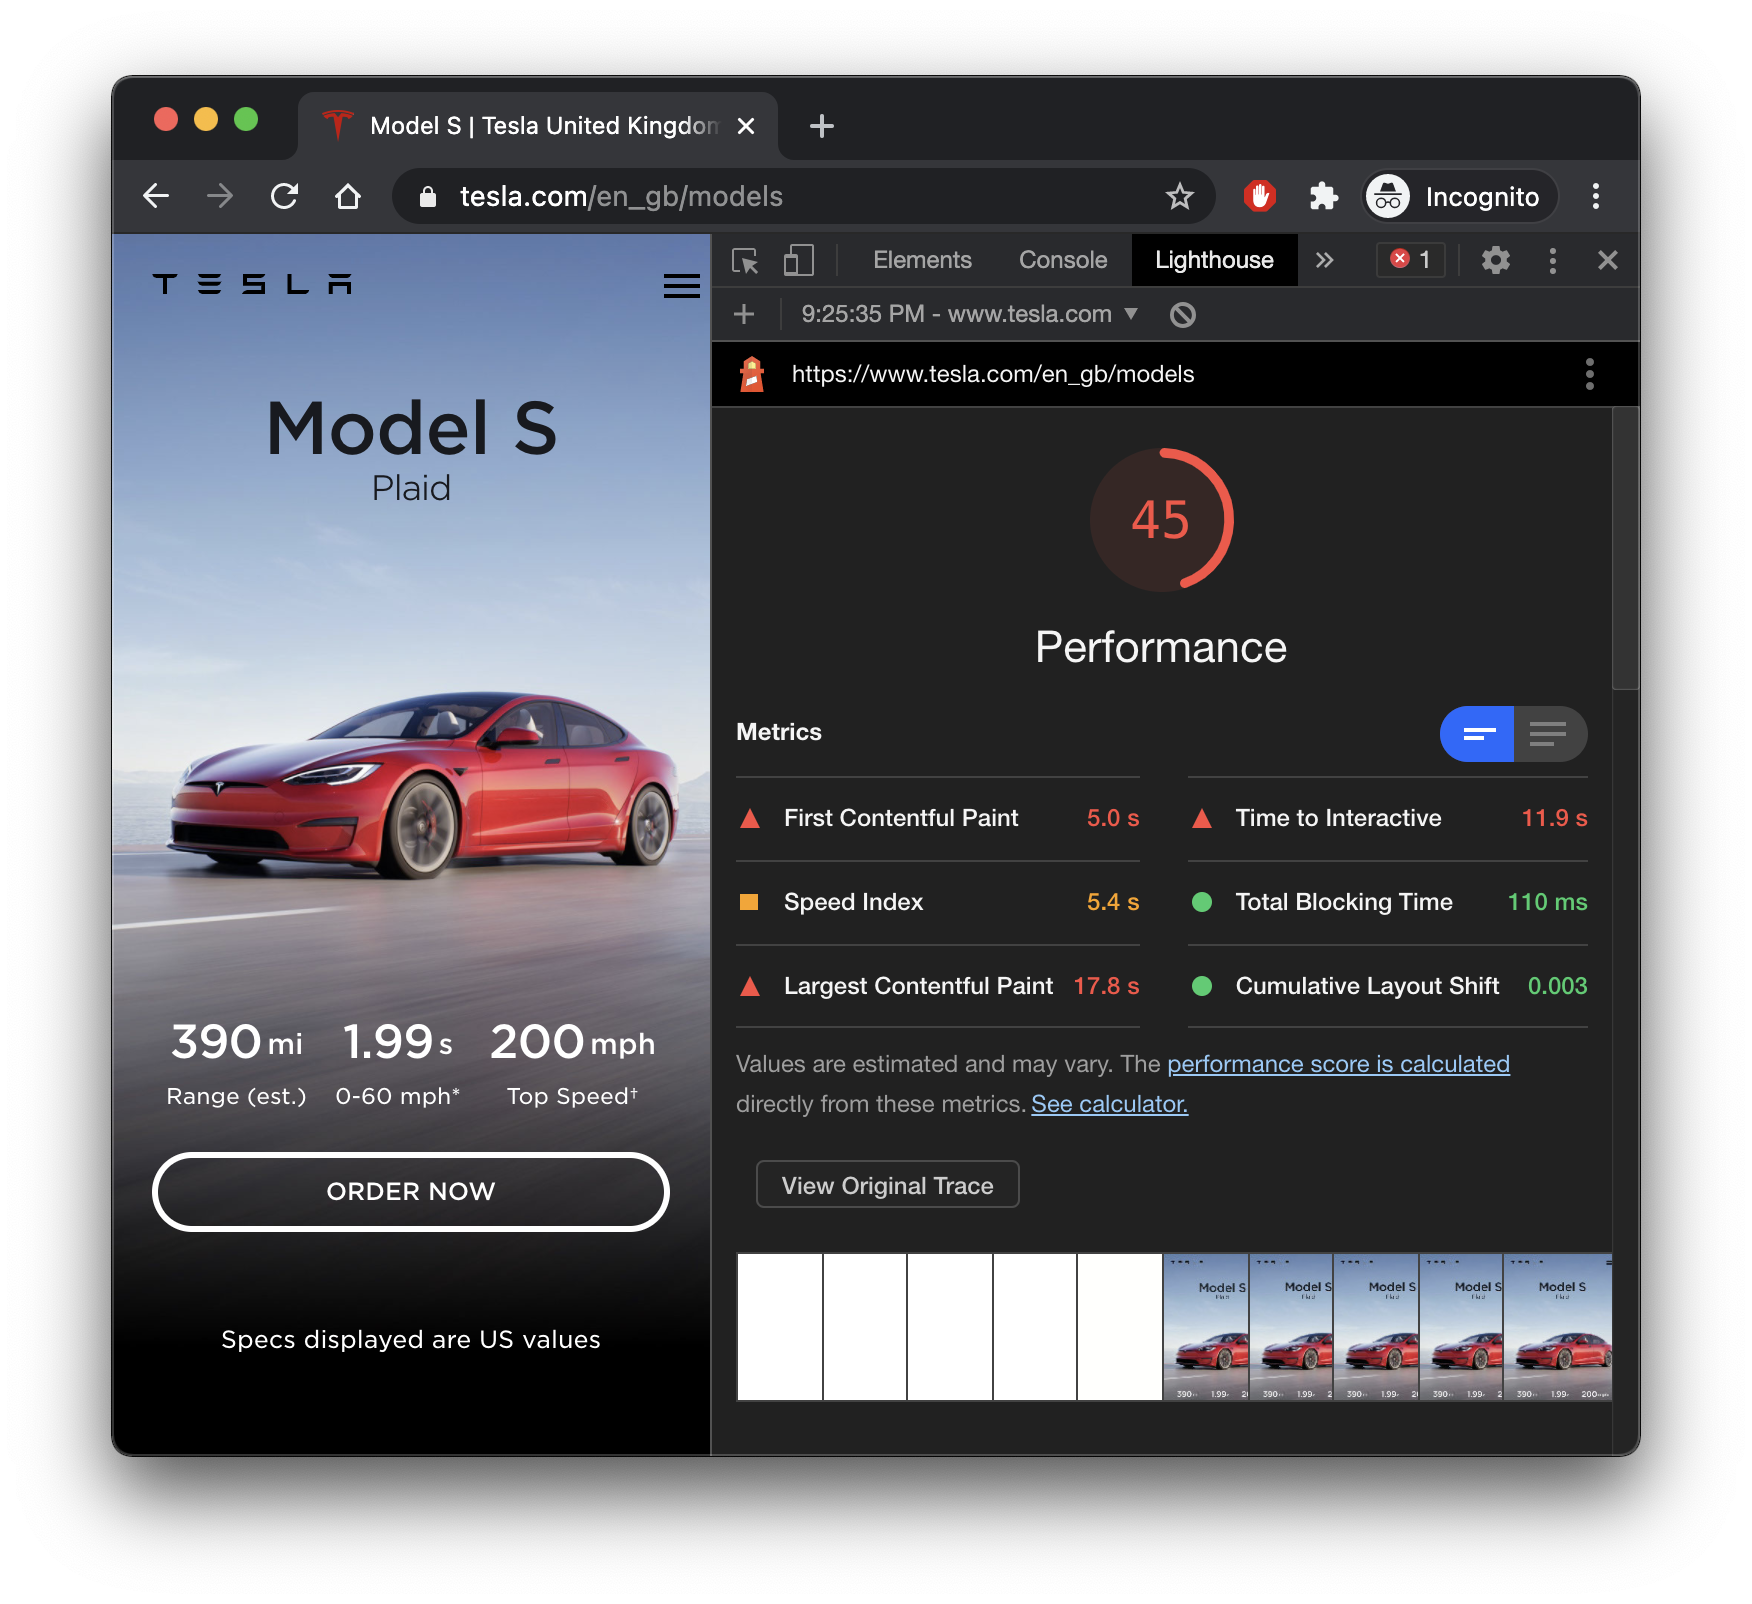
This is a rather new metric, but it's also extremely important and isn't something that can be measured in Lighthouse all that well. CLS is the amount in pixels that the website's layout moves around over time from the first time it loaded. Lighthouse won't be able to help us much as it is not simulating an actual user using the website over time. Here's an example of Tesla.com's new Model S page Lighthouse score:

However we will find that there is an issue with this website — the Order Now button, which is arguably the most important conversion action on their page, can be missed by a real user due to a carousel further up the page having variable content size, making the whole layout shift up and down periodically.
A common cause of layout shift is carousel or slider components with variable content sizes. When elements above the fold change height, everything below shifts — and that can cause users to miss critical calls to action. The developers who build these components probably didn't realise the issue, because it doesn't happen on all screen sizes.
We have a couple of options when it comes to identifying these sorts of issues. As usual Google is our friend. You can use the data at Google Search Console if you have it set up for your website. This will give you more real-life information about your users' experience while using the website. One can also collect measurements from Web Vitals, which is a whole topic in its own right.
At Inlucent we have our own approach for collecting Web Vitals information from real users. If user experience is as important to you as it is to us, get in touch — we're happy to talk about improvements.